Forces Files
All these files may be found here.
- multirun.csh (used to run a number of identical yet independent SMD simulations)
- smd-multi.namd (NAMD configuration)
- smd-multi.tcl (NAMD TCL forces)
- a8-new.pdb (corresponding PDB)
- a8.xplor.psf (corresponding XPLOR format PSF)
- write_data_multi.tcl (TCL script to generate work data)
- make_da_dat.csh (script which combines the work data into a matrix)
- all.tcl (script which combines all components of the 10Ala tutorial, and writes out data)
In order to get the net work from the forces, you need to use multirun.csh first (which calls smd-multi.namd and smd-multi.tcl). After the simulations run, you use make_da_data.csh to generate the da.dat file. Then, use all.tcl to generate the final result. Of course, you will need to examine and edit all these files to suit your needs. In particular, the initial positions in the PDB file and smd-xxx.tcl must match, the pulling velocity may be adjusted (which affect the total run length and displacement), and parameters in all.tcl must be matched up with these settings.
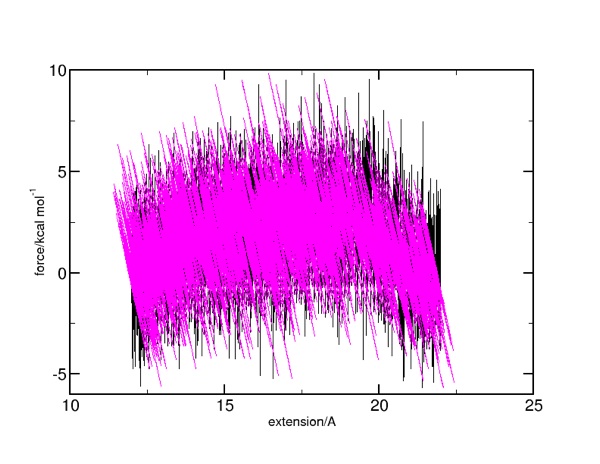
Here is what the force versus extension (not actual) displacement. The force against actual displacement is in black:
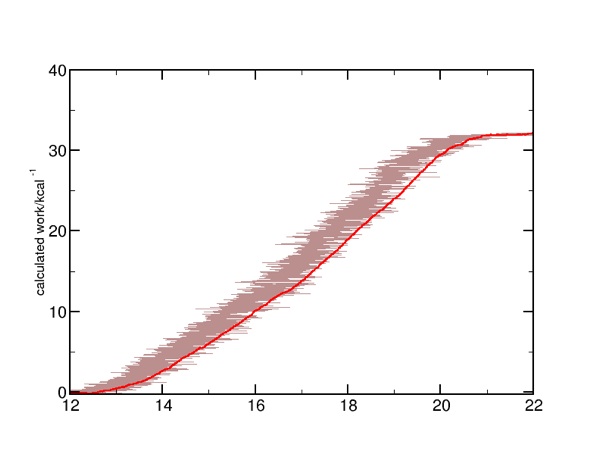
Here is what a single run's calculated work looks like. Notice the difference when it is plotted versus the actual displacement (brown) versus extension (red):
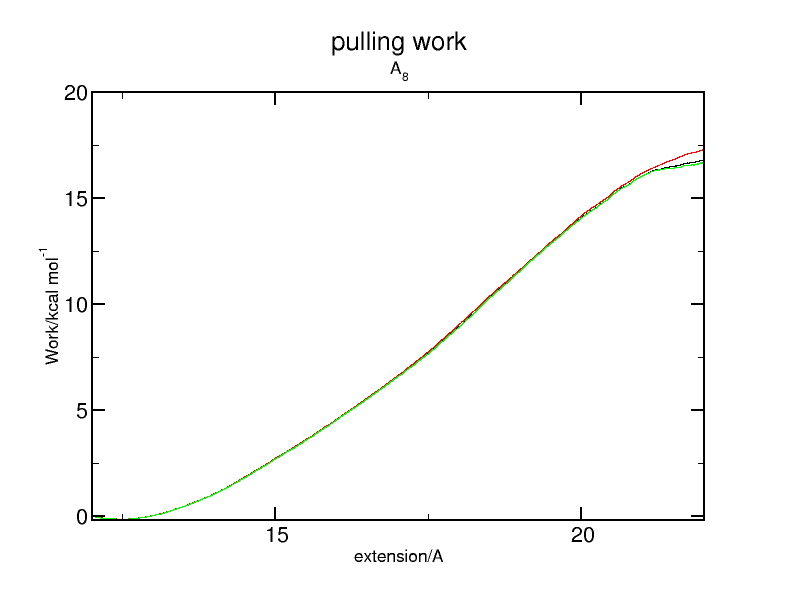
here is the analytical result for the work for the alanine 8-mer. Simple average and 1- and 2- term cumulant expansion work.
Hydrogen bond analysis files
make_hbond-dat.csh (this takes individual hbond trajectory data from the VMD HBond utility)
split-hb-traj.tcl (This is the ending step of using the VMD Timeline Hbond data)
The hydrogen bond-analysis can be complex. Showing how the hydrogen bonds are pulled apart, and equating forces (as determined above) with specific hydrogen bond breaking is our task. VMD has two hydrogen bond utilities: the standalone one, and the one supplied as part of the Timeline Analysis tool. Of these, the latter is better as it gives more detailed information. But we will go over both.
VMD Hbond
This utility is useful to show overall counts for hydrogen bonds, but it cannot pick out individual hydrogen bond triplets. In order to make sure we count all appropriate Hbonds, here are some appropriate settings:
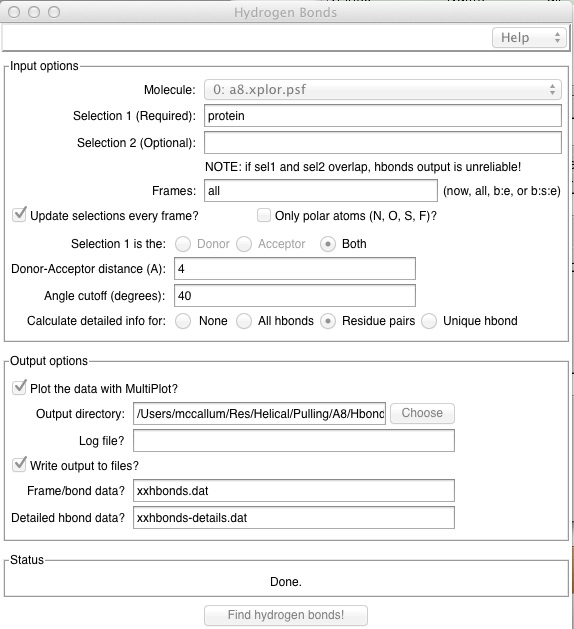
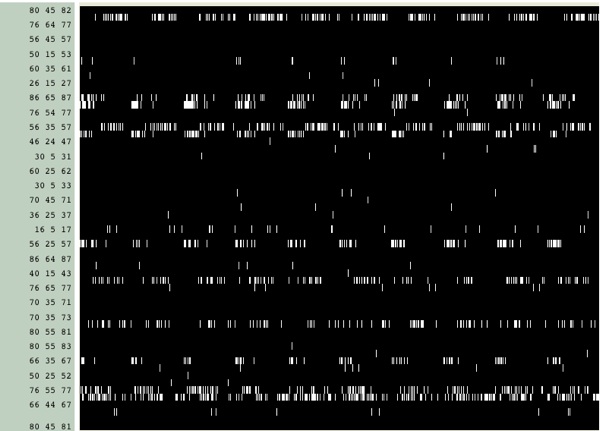
NOTE that this will also catch some in-appropriate Hydrogen bonds. Realize that a plot produced from this data is good to show general trends in hydrogen bond gain or loss only. If you select "Detailed hbond data", percent occupancies over the course of the trajectory will be computed for residue pairs, but a time-based list would be more desirable.
Typically what I do with this data is compute a running average over 25 steps. This flattens out the data and shows the trend better. Also note that this hydrogen bond data is based off the DCD file, which means the number of data points probably do not match the force data. If you like, the force output (listed in the .tcl and/or .namd files) could match the DCD output control (also in the .namd file). In all probability, you have a number of identical runs (say 10), and you want to average over them, THEN take a running average. In xmgrace, you would first load all your data sets, then choose "Data -> Transformations -> Evaluate Expression". In xmgrace, a set's (x,y) values are assigned variables as (s0.x, s0.y) for the first set, (s1.x, s1.y) for the second, and so on. Select one set (you must select at least one set), and in the dialog box type "y = (s0.y + s1.y + s2.y + s3.y + s4.y + s5.y + s6.y + s7.y + s8.y + s9.y)/10." and hit "accept". This will create a new data set which is an average of the y values.
Timeline HBond Utility
This utility is more flexible, and gives much more detailed information. In order to collect data from all the individual runs, load them all sequentially into your molecule. So instead of having 10 individual 1000-frame trajectories, you might end up with a single 10,000-frame trajectory. Now, whether you use timeline to show a DSS plot or some other function (such as Hbonds), you should see a periodic pattern in the data (this had a HBond distance of 3.5 A and an angle of 30 degrees):
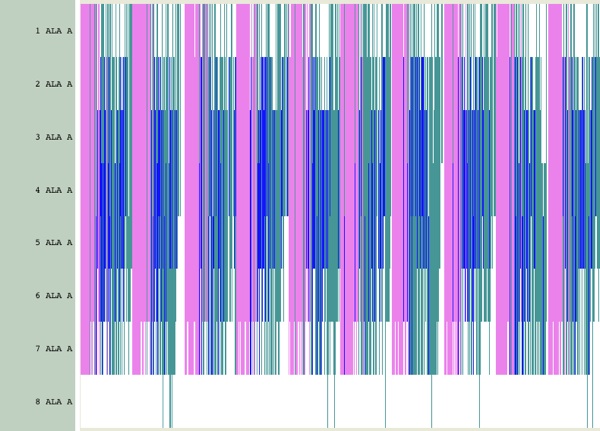
What we want to do is first: identify the types of hydrogen bonds in this data (alpha-helical or (i,i+4) versus something else), and then, unwrap the data from a list of lists into a block data set.
In order to identify the hydrogen bonds, expand the y-axis when viewing HBonds in the timeline.